

The efficiency of photovoltaic systems is directly influenced by the orientation and tilt angle of the solar panels relative to the ground, specifically the angle at which direct sunlight strikes the panel surface. Under the same conditions - such as location, panel type, power capacity, inverter configuration, and others - different installations have varying production characteristics, both in absolute and relative terms.
For a given set of various photovoltaic system types with identical installed capacities, virtually placed in the same location, without terrain size's or shading limitations, it is possible to define the theoretical maximum production potential, against which the efficiency of each system can be assessed.
The standard group used for statistical comparison includes the most common types of static photovoltaic systems: those with a fixed tilt angle (15°, 20°, 25°, 30°, and 35°), and systems in an East/West configuration (with 10° and 15° tilts). The exact spatial orientation may vary depending on terrain, but the baseline assumption is that the central axis is oriented North/South (180°S).
The calculation of relative efficiency is based on the ratio of actual production to the theoretical maximum for the group (with mixed production), expressed as a percentage of the maximum possible kWh/kWp (energy produced per unit of installed capacity) over a given period. The data is based on average statistical values for total annual, monthly, and hourly production, measured over a full calendar year.
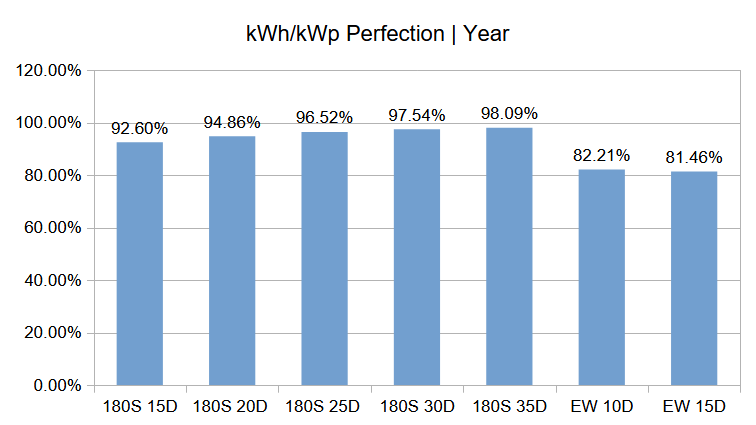
Regarding monthly generation efficiency, the calculation differs based on whether it is relative to a specific month or based on a weighted average according to the share of monthly production in the total annual output. The first method focuses on the system’s performance quality during a given month, while the second method analyzes the quantitative expression and distribution in relation to annual efficiency.
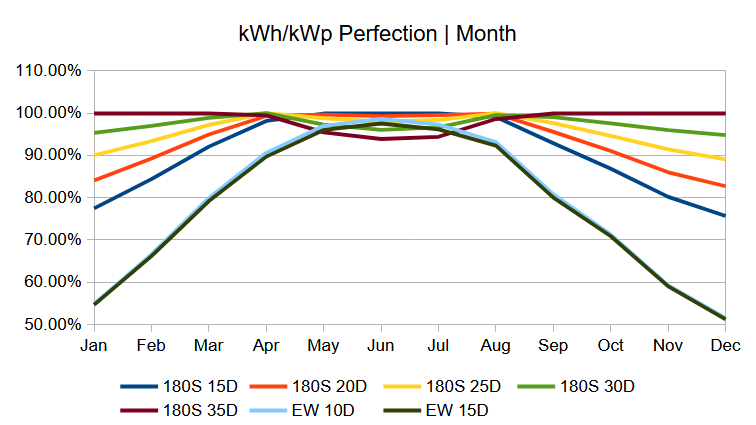
For standard monthly performance, fixed-tilt photovoltaic systems with a southern orientation perform better in the winter months (90% to 100% of the group’s maximum), while in the summer months, due to the higher position of the sun in the sky, systems with a lower tilt angle show a slight advantage. In contrast, East/West systems exhibit significantly lower overall efficiency, reaching near maximum output only for a short period, during the longest days of the year when the sun is at its highest.
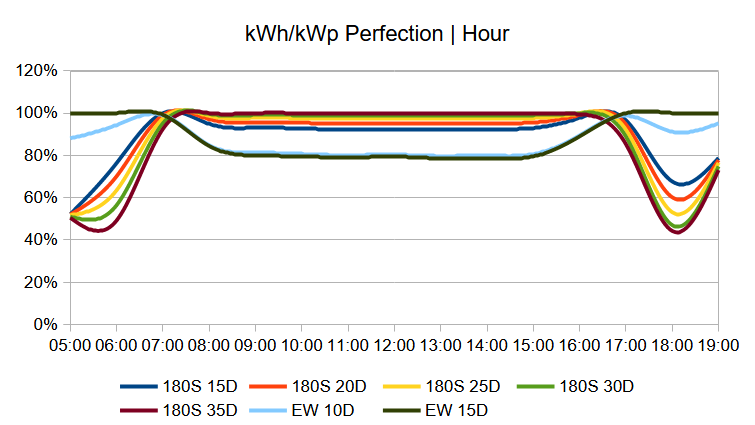
Regarding hourly efficiency, the average efficiency of fixed-tilt systems with a southern orientation is stable between 7:00 AM and 5:00 PM. Those with a steeper tilt (30° and 35°) have up to a 10% advantage, despite the monthly fluctuations. On the other hand, East/West systems have up to 20% lower efficiency during this period, but show a significant advantage during the early morning (5:00 AM to 7:00 AM) and late evening (5:00 PM to 7:00 PM), due to the angle of sunlight. However, this advantage can be misleading in selecting a preferred system type.
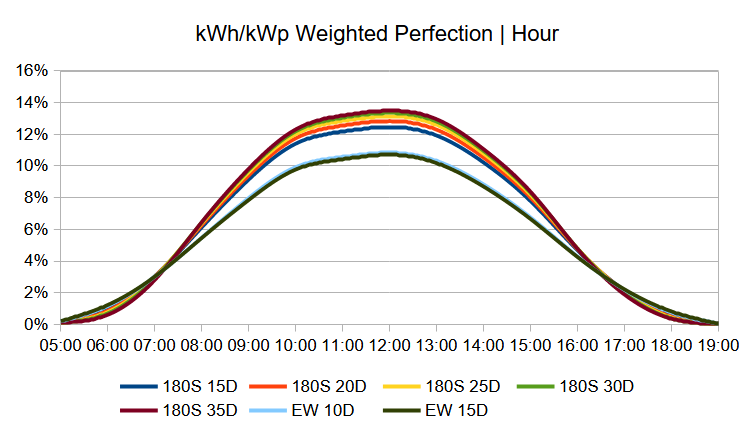
With the addition of quantitative data, the early and late-hour advantage of East/West systems shrinks and contributes no more than a 3% total increase in efficiency during these time periods (5:00-7:00 AM and 5:00-7:00 PM). For the rest of the day, fixed-tilt systems perform much better, with those at steeper angles generally outperforming those with lower tilt angles.
The analysis of photovoltaic system efficiency is not limited to technical parameters, as the ultimate measure of effectiveness is revenue generation. While fluctuating electricity prices add complexity, incorporating them into the efficiency calculations determines the ultimate return on investment.
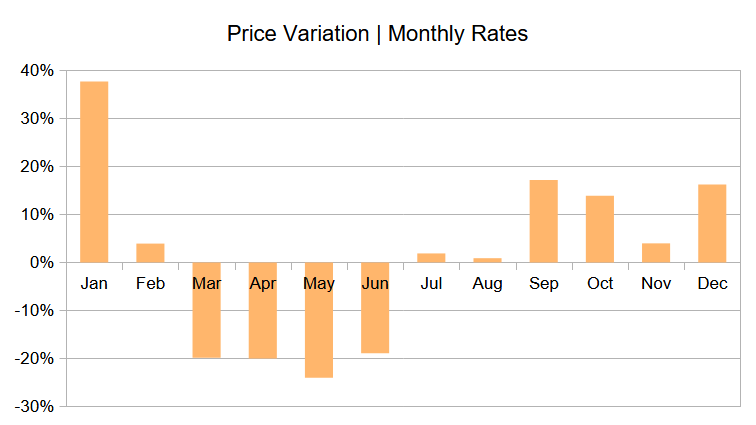
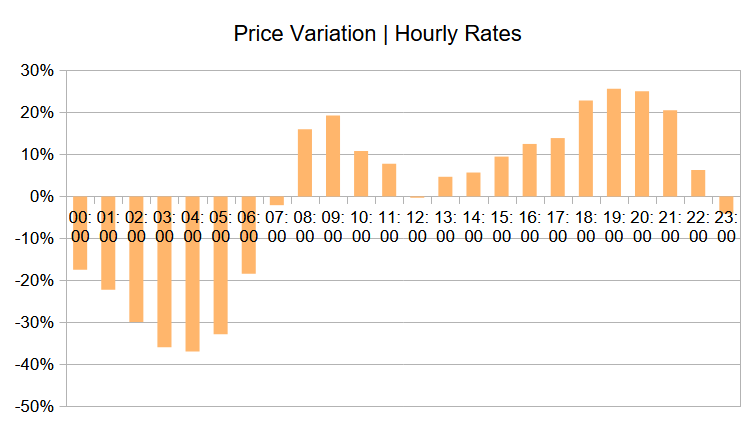
For simplicity and statistical normalization, electricity price fluctuations can be categorized into two primary trends: monthly dynamics based on relative changes from the annual average price, and daily dynamics based on changes from the average daily price.
Monthly price dynamics, are a function of increased demand during certain periods of the year, such as for heating or cooling, and reduced demand in periods when these are not needed. The highest demand, and thus price, occurs during winter, while spring and early summer are characterized by lower energy consumption and milder climate conditions. Summer prices stabilize around the annual average.
Daily price dynamics are influenced by the presence or absence of specific energy consumers during particular time periods. Electricity prices are significantly below the daily average during the night (12:00 to 6:00), starting to rise with the workday. Prices peak around 18:00 to 21:00, when people return home, and energy consumption increases significantly.
These price dynamics, when compared to the production characteristics of each system, allow for modeling and evaluation of relative Financial efficiency. This is represented as the percentage ratio of the projected revenue of each system to the theoretically maximum possible mixed revenue for the group.
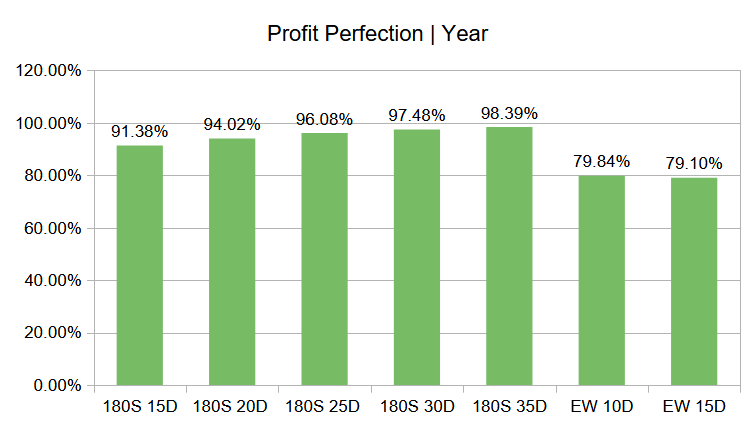
Having all above in mind, the complex analysis and correlation of all data allows for a comparative representation of photovoltaic systems based on two key indicators — energy efficiency and financial efficiency. This helps identify the most optimal solutions for solar energy investments.
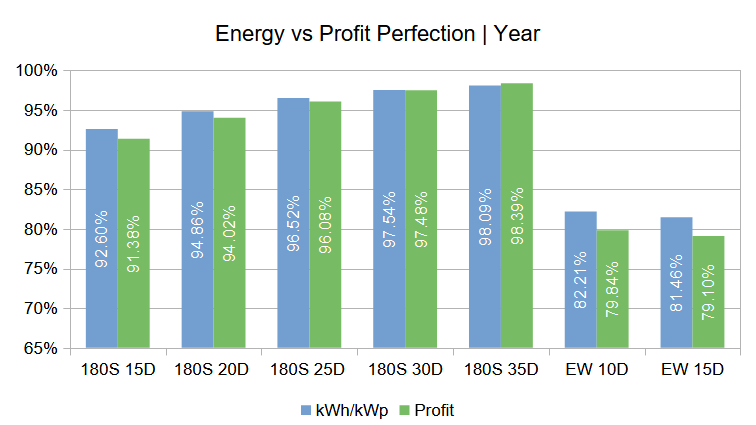
Most of the analyzed photovoltaic systems exhibit lower financial efficiency relative to their energy efficiency, primarily because they generate a significant portion of their energy during periods characterized by lower electricity prices, leading to reduced revenue and financial performance.
This characteristic is especially pronounced in East/West systems, which generate energy over a longer portion of the day compared to other systems but have a lower peak output.
The nominal balanced system from the analyzed group is the one with a tilt of 30°, while the most effective is with a tilt of 35°, where the financial efficiency exceed the energy one, suggesting that this tilt angle achieves the optimal balance between energy generation and the price at which it is sold.
© 2024/2025 Smart Energy Group / Nikola Vasilev